
All posts in the series:
- Linear Regression
- Logistic Regression
- Neural Networks
- The Bias v.s. Variance Tradeoff
- Support Vector Machines
- K-means Clustering
- Dimensionality Reduction and Recommender Systems
- Principal Component Analysis
- Recommendation Engines
At a first sight Recommender Systems (RS) and Dimensionality Reduction (DR) have pretty much nothing in common. They solve different problems in different domains of Machine Learning.
If we take a closer look though, we would realize this is far from being the case. It actually turns out that both RS and DR benefit from a particularly powerful mathematical operation called Matrix Decomposition. In this post we are going to try to understand why this process is so important and beneficial for such different ML problems.
Most sources of data can be represented as large matrices. Due to their size though, they are generally computationally expensive and inefficient to treat. It is therefore natural to try finding an alternative and somewhat less complex depiction of the problem. An idea could be to write the original matrix as a product of two or more smaller ones. There would be multiple benefits if he could get this done: first of all smaller entities are generally more manageable, second, we would expect the factorization to unveil hidden patterns in the data set. These smaller matrices would contain the same information stored in the original matrix, just organized in a much more condensed, structured and easier to interpret way.
Singular Value Decomposition
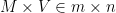
One of the most elegant algorithm to obtain just the above is the so called Singular Value Decomposition. The theorem behind this technique states that it is always possible to write a matrix 

- The columns of the matrix
represent an orthonormal basis (unitary module and perpendicular to each other) called the left singular vectors of
(NB: theoretically SVD spits out
. This is the default result for linear algebra libraries such as numpy as well. Practically, it doesn’t matter, as, depending on
or
, the additional
rows/columns in
will be multiplied by zero columns/rows in
).
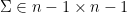
is a diagonal matrix whose elements are called the singular values of
, which is not a square matrix. Practically, this is not relevant as the additional
- The rows of the matrix
represent an orthonormal basis called the right singular vectors of

For future reference, it is very important to keep in mind that SVD provides an exact decomposition of a matrix. There is no approximation in stating 
The relationship with the eigenvectors of the covariance of
Before moving any further it is important to spend some time on the relationship between SVD and eigen-decomposition. The two operations are very closely related and surfacing these ideas will make our lives easier in the subsequent part of the post.
Let’s start from the following (given
\begin{equation} \label{eq:svd1} M^T = (U \Sigma V^T)^T = (V^T)^T \Sigma^T U^T = V \Sigma U^T \end{equation}
where we exploited the fact that
\begin{equation} \label{eq:svd2} M^T M = V \Sigma U^T U \Sigma V^T = V \Sigma^2 V^T \end{equation}
where we can simplify 


\begin{equation} M^T M V = \Sigma^2 V \; (1) \end{equation}
Now, remember that given a matrix 


- The left-singular vectors of
.
- The right-singular vectors of
- The non-zero singular values of
).
Having set the above premises, let’s see how all of this applies to Dimensionality Reduction first and to Recommender Systems after.
Dimensionality Reduction
We have a matrix 

- Data visualization purposes. We cannot really display a matrix
where
.
- We are working on a ML model which is very computationally expensive to train. A solution could be to reduce the number of features we feed the algorithm with.
- We need to save RAM, hence we have to reduce the size of the data set
The important thing here is that we want to come up with a matrix 
We can achieve this goal in two ways. Both using matrix decomposition. In both cases we will be performing Principal Component Analysis (PCA). We will just apply it to different matrices.
Eigenvectors of
Remember, our starting point is 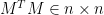


How do we interpret what we have just done?
PCA takes a data set consisting of a set of tuples representing points in a high-dimensional space and finds the directions along which the tuples line up best. The idea is to treat the set of tuples as a matrix
The matrix of these eigenvectors can be thought of as a rigid rotation in a high dimensional space. When we apply this transformation to the original data, the axis corresponding to the principal eigenvector is the one along which the points are most “spread out”. More precisely, this axis is the one along which the variance of the data is maximized (confirmed by the highest eigenvalue associated with it). Put in another way, the points can best be viewed as lying along this axis, with small deviations from it. Likewise, the axis corresponding to the second eigenvector (associated with the second-largest eigenvalue) is the axis along which the variance of distances from the first axis is greatest, and so on.
How do we choose
We can achieve that checking the proportion of variance explained (PVE) by each principal component. Considering that the total variance of the data set is equal to (
\begin{equation} \label{eq:pve1} \sum_{j=1}^n \frac{1}{m} \sum_{i=1}^m x_{ij}^2 \; (2) \end{equation}
(

\begin{equation} \label{eq:pve2} \frac{1}{m} \sum_{i=1}^m z_{ik}^2 = \frac{1}{m} \sum_{i=1}^m \Big( \sum_{j=1}^n \phi_{jk}x_{ij}\Big)^2 \; (3) \end{equation}
 where
where 


As you can see, the more components we add the more variance we explain. It’s up to us to set a reasonable threshold.
Singular Value Decomposition on
Another possibility consists in applying Singular Value Decomposition to
SVD provides us with the best axes to project our data on, where by best we mean that these axes gives the minimum matrix reconstruction error and maximum variance per axis. In practice the axes we are talking about are 


Recall, 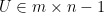


Bottom line, if we apply the above procedure we would shrink the 

A rule of thumb is to keep 80-90% of the energy of 

Side note on eigen-decomposition and SVD of a symmetric matrix
You may stumble upon a third way of performing dimensionality reduction. The result would be identical to the two first processes explained above, but it can be pretty mind blowing if you don’t stop and think abut it.
The key to this approach is that if 


Nothing beats StackExchange!
I really did my best to summarize the above concepts, but it would be almost impossible to beat the elegance and transparency of the following posts on StackExchange. Take the time to go over them as they just make everything so cristal clear!
- How to explain PCA to your family
- We say that PCA minimizes the reconstruction error and maximises the variance of the data along principal components. Why?
- The first principal direction is given by the covariance eigenvector with the largest eigenvalue. Why?
- Can you elaborate on the mathematical proof between eigen decomposition and SVD?
Bridging Dimensionality Reduction to Recommender Systems
I have to acknowledge that everything we have discussed so far can seem pretty abstract. To bring us back from theory to practice, unexpectedly, Recommender Systems (RS) come to the rescue, proving how close they are to Dimensionality Reduction. If SVD sounded a bit esoteric to you, let’s see how the concept space makes much more sense when applied to a utility matrix users 
Let’s do it and check out the below example (taken from the Mining Massive Data Sets Stanford course material). Here we have 6 users rating 5 movies. It turns out that, out of these, the first 3 are SciFi whilst the other 2 can be classified as Romance. Now, as you can see, the 

It is interesting to see how naturally SVD offers a nice and clean interpretation of a Recommendation-Engines-related problem. What we’ll do next is actually going down this road a lot more in detail trying bridging DR and RS even further.
First of all, we’ll briefly introduce RS, walking through the various available frameworks in order of complexity. Respectively Content Based (CB), Collaborative Filtering (CF) and the modern industry approaches combining CB, CF and Machine Learning in new algorithms known as either Low Rank Matrix Factorization Systems (wasn’t SVD factorizing a matrix too?) or Latent Factor Recommender Systems.
This very last piece will let us close the loop with Dimensionality Reduction techniques.
Recommender Systems
Everybody is familiar with Recommender Systems. If you have ever shopped on Amazon you couldn’t have possibly missed the list of items the website constantly suggests to you. Some of them make more sense than others, in any case we have to acknowledge that the “you may also like” products are curated in a pretty decent way. How does Amazon guess what I am most likely to buy next? How does Netflix knows I am going to watch the movies it is suggesting to me?
There are three main approaches to answer these questions
- Content Based Systems
- Collaborative Filtering
- Latent Factor Models
We are going to scratch the surface of all of them. Let’s get started.
Content Based
The idea behind CB systems is to build a profile for each user and item. A profile is nothing else than a vector with as many entries as the number of features we have chosen to describe the object. Let’s suppose our objects are movies and our users are Netflix subscribers. We can think of features as attributes of the object. There are countless features we can come up with: actors, director, year of release, genre and so on so forth. For the sake of simplicity we are going to use just two of them: Julia_Roberts and Denzel_Washington. We summarize every movie in the catalog by only these two boolean attributes. Hence, a film is described by a two dimensional profile whose first entry is 1 if the movie stars Julia Roberts (0 otherwise), and whose second entry is 1 if it stars Denzel Washington(0 otherwise). Ok, that was easy. We have the items’ profiles.
How do we get users’ profiles?
What we could do is getting all the movies watched by a user and then extract the Julia_Roberts and the Denzel_Washington features averaging them out across movies. So, say, out of the 10 films Francesco watched 3 starred Julia Roberts, then the Julia_Roberts attribute would be 0.3. Applying the same logic to Denzel_Washington, we get 0.7. This is of course a super simplistic version of the story. First of all no company would go ahead with just two features, but most importantly we would need to address a number of potential issues. Do we want a straight average? How do we normalize star ratings? How do we weigh positive ratings versus negative ones?
In any case, after all of it, the result is a two dimensional vector describing Francesco’s tastes (seems like he loves Denzel Washington!). How do we now predict which movies Francesco should watch next?
This is just a matter of checking how similar Francesco is to the Netflix catalog. There are a number of ways to quantify similarity. One of the most effective in high dimensional spaces is the cosine distance, which is based on calculating the cosine of the angle 


\begin{equation} cos\theta = \frac{\textbf{u} \cdot \textbf{i}}{\lVert \textbf{u} \rVert_2 \lVert \textbf{i} \rVert_2} \end{equation}
So basically, Content Based Recommender Systems can be summarized as building 
Collaborative Filtering
Another popular approach to Recommender Systems is called Collaborative Filtering. One of the aspects you may have noticed when dealing with the Content Based framework is that each user is treated individually, cutting any possible connection with other customers. This has some interesting pros, such as the ability to cope with users having very unique tastes, but it also presents some major cons, most notably the need to find meaningful features to summarize items-users. That’s generally super hard to get. For instance, if you had to suggest a picture, which attributes would you choose? Good luck with that.
Collaborative Filtering introduces a radically different approach, based on the following very simple observation. If I have to recommend an item to a user, why don’t I look for similar customers and check what these people thought about the item in question?
This is the so called user-user collaborative filtering approach. The idea makes sense but as soon as we start thinking about it we realize that it is not that easy to find “similar customers”. Well, of course, we can pre-process the data set with some clustering or simply apply user-user cosine distance. We would definitely find the 
So let’s say we have to predict 


\begin{equation} \label{eq:cf1} r_{xi} = \frac{\sum_{j \in N(i,x)} s_{ij} r_{xj}}{\sum_{j \in N(i,x)} s_{ij}} \; (4) \end{equation}
where 


Equation (4) is intuitive and actually very effective!
The biggest CF’s pro is that it works with any kind of product, with no need to build any features set (a major problem for CB). Despite this point, CF has some serious drawbacks.
- Cold start: at least some ratings are needed to provide a recommendation. How do we deal with new users/products? (CB suffers from this issue too)
- Sparsity: given the utility matrix, it is generally not easy to find similar users/items. The data set is just too sparse as only a tiny fraction of users has rated a tiny fraction of items
- Popularity Bias: this is the so called “Harry Potter Effect”. Due to how equation (4) is built, the system tends to recommend popular items, making it harder to spot hidden gems.
Something worth exploring to address the above issues is the adoption of hybrid methods, consisting in making predictions via two or more models and then merging results together to spit out a final recommendation. An example of such an approach is the integration of Collaborative Filtering with a Global Baseline.
Let’s directly throw the Global Baseline formulation into the mix, then we will discuss the significance of each term
\begin{equation} \label{eq:gb1} b_{xi} = \mu + b_x + b_i \; (5) \end{equation}
Equation (5) is composed of:
: global baseline for the rating provided by user
: average rating of all items across all users
: deviation of user
: deviation of item
Now, given the Global Baseline formulation introduced in (5), we can correct (4) and obtain the following enhanced equation
\begin{equation} \label{eq:cf2} r_{xi} = b_{xi} + \frac{\sum_{j \in N(i,x)} s_{ij} (r_{xj} – b_{xj})}{\sum_{j \in N(i,x)} s_{ij}} \; (6) \end{equation}
where we subtract 
This is a good improvement over a simple CF, as the introduction of a global view of the data helps solving issues like sparsity and cold start.
Even if we are going in the right direction, the previous approach is still too simplistic for models currently used in industry. We’ll see below how to give a significant boost to recommendations engines.
Latent Factor Models – A modern Recommender System
Not sure you have noticed but so far we haven’t really applied any machine learning algorithm. Both CB and CF can be seen as way of extracting information from an existing data set via some basic linear algebra. Nobody is really learning anything here.
The idea we want to propose now is to add another layer to the previously explored ones. An optimization layer leveraging matrix factorization.
Let’s start from the utility matrix 


It seems we are done. SVD offers us the solution we were looking for. There is a complication though. The summation within the RMSE is over all the entries in
Even though we can’t directly apply Singular Value Decomposition, we can still tweak it for our needs. After all, its original formulation is pretty close to what we wanted to achieve. The tweak I am talking about consists in re-formulating SVD as the following minimization problem
\begin{equation} \label{eq:lf1} \displaystyle \min_{P, Q} \sum_{(i,j) \in R} (r_{ij} – q_i p_j^T)^2 \; (7) \end{equation}
where now the summation is just over the non-null elements in 
(7) looks already good but a very reasonable enhancement could be added without much effort: global effects. After all, right now, our prediction is just based on 
\begin{equation} \label{eq:lf2} \widehat{r_{ij}} = \mu + b_j + b_i + q_i p_j^T \; (8) \end{equation}
This is great. Now we can plug (8) in (7), add regularization terms (to prevent overfitting) and get the final optimization problem
\begin{equation} \label{eq:lf3} \displaystyle \min_{P, Q, b_j, b_i} \sum_{(i,j) \in R} (r_{ij} – (\mu + b_j + b_i + q_i p_j^T))^2 + \lambda (\sum_i \lVert p_i \rVert^2 + \sum_j \lVert q_j \rVert^2 + \sum_i \lVert b_i \rVert^2 + \sum_j \lVert b_j \rVert^2) \; (9) \end{equation}
So now we have 
To conclude let’s have a closer look at how all these models perform.
A perfect example is provided by the Netflix Challenge. In October 2006 Netflix released a an internal data set of users
In the image below (taken from the Mining Massive Data Sets Stanford course material) you can check the progress. As you can see a basic CF already beats Netflix lowering the RMSE to 0.94. As soon as the model starts growing in complexity the error goes down, getting to a pretty outstanding 0.89 if we apply (9). The last mile, down to 0.8563, was achieved merging multiple engines together in a giant model with billions of parameters, which was actually never implemented in production.

Follow me! If you like what you are reading feel free to follow me on LinkedIn or Twitter!


